Rental Market Trends in the U.S. — Is Rent Going Up?

Many or all of the products featured here are from our partners who compensate us. This influences which products we write about and where and how the product appears on a page. However, this does not influence our evaluations. Our opinions are our own. Here is a list of our partners and here's how we make money.
• Updated May 11, 2023 to include the latest Zillow rental data.
More than 35% of households in the U.S. rent homes, according to 2017-2021 data from the U.S. Census Bureau . And it’s more expensive than ever to do so.
The high cost of rent derives from a variety of factors, including:
Inflation. Higher costs across the board mean landlords pass on higher costs (such as rising wages for maintenance workers or repair costs) to renters. Higher rent costs contribute to inflation and the cycle repeats.
Lack of inventory. There is a shortage of vacant rental properties in general, and of affordable ones in particular.
Expired rent freezes and discounts. Landlords are making up for pandemic-era rent freezes and steep discounts in urban areas by hiking prices on new units and lease renewals.
A shifting workforce. As the pandemic increased the popularity of remote work, deep-pocketed renters sought larger homes in areas that had been previously relatively low-cost. This migration increased rents in suburban areas more than it lowered them in urban ones, yielding a net increase in rents.
More demand to live alone. Prospective renters are increasingly looking for studio and one-bedroom apartments, driving up demand for available housing, according to a November 2022 report from the real estate website StreetEasy.
Barriers to homeownership. Prospective homeowners remain renters for longer as they face high demand and low inventory of existing homes, rising mortgage interest rates, as well as supply chain disruptions that have made it more expensive and difficult to construct new homes.
As mortgage rates rose over the past year, housing prices cooled faster than rents, which are rising at a slower pace than they did in 2021, but at a more rapid clip than before the pandemic.
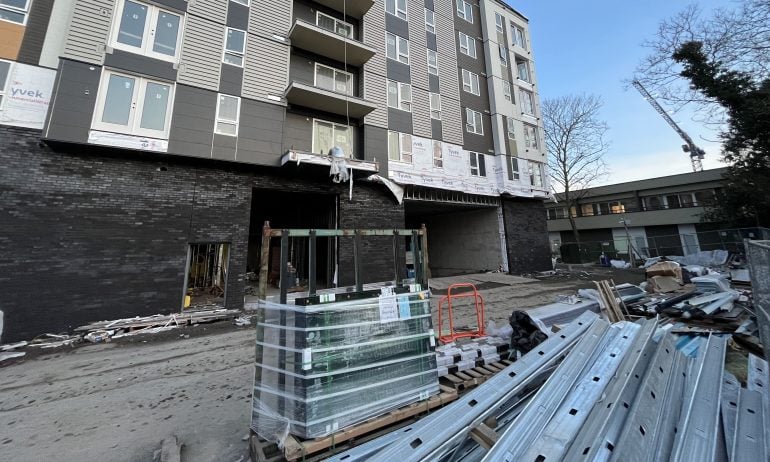
In 2022, a promising development began: Multifamily construction in 2022 reached a 50-year high nationwide, according to the rental listing service RentCafe. A new supply of housing could help to bring down overall rent costs. And since many cities require inclusionary housing — meaning a portion of new housing must be affordable — new construction also means new affordable housing. However, construction overall has slowed due largely to rising interest rates, which could delay the completion of new rental projects.
On Jan. 25, the Biden administration proposed a “Blueprint for a Renters Bill of Rights,” a new set of federal actions aimed at promoting rental affordability that also include guidelines to strengthen tenant protections .
Is rent going up or down?
The price of asking rents increased by 0.6% from March to April, according to the real estate website Zillow’s rental report for April 2023. The increase is slightly lower than the typical increase of 0.7% averaged over past Aprils from 2016 to 2019.
Typical asking rents in the U.S. are now $2,018, a 5.3% increase compared with the same time last year. Rent growth, overall, has been slowing since its 16.9% year-over-year peak growth in February 2022. The current year-over-year rate is 0.5% higher than the peak typical rent of $2,008 in September 2022. And combined with gains in previous months, it’s a 1.3% increase since January when rent was $1,991 — the most recent low point in the rental market.
The following are the latest increases and declines from Zillow’s analysis of housing data in 50 cities:
Cities with the highest rent increases
Month-over-month:
Providence, R.I. (+1.71%)
San Diego (+1.29%)
Hartford, Conn. (+1.28%)
New York City (+1.28%)
Boston (+1.15%)
Year-over-year:
Boston (+8.5%).
Cincinnati (+8.1%).
Providence, R.I. (+8.0%)
Louisville, Ky. (+7.5%).
Kansas City, Mo. (+7.4%)
Cities with the lowest rent increases
Month-over-month:
Buffalo, N.Y. (+0.06%)
Portland, Ore. (+0.06%)
San Antonio (+0.07%)
Sacramento, Calif. (+0.23%)
Detroit (+0.31%)
Miami (+0.31%)
San Jose (+0.31%)
Austin, Texas. (+0.31%)
Las Vegas (+0.31%)
Year-over-year:
Las Vegas (-1.2%)
Phoenix (+0.7%)
New Orleans (+1.4%)
Austin, Texas (+1.8%)
San Francisco (+2.1%)
Salt Lake City (+2.1%)
Rent vs. inflation
Rent is a major contributor to inflation and the cost of rent is also impacted by inflation. The price index for shelter, which includes rent, makes up the biggest portion (34%) of the consumer price index, a proxy for inflation . April 2023 data from the Bureau of Labor Statistics shows shelter, which includes rent, was a primary contributing factor for the overall inflation increase and the biggest factor in the core inflation increase, which excludes food and energy. Over a 12-month period ending in April, shelter was up 8.1%.
For rent, specifically, the month-over-month increase from March to April (0.6%) is slightly higher than the increase from February to March (0.5%).
But there’s also a lag in how rent data is reflected in the CPI, which means we won’t have a clear picture of housing for the bulk of 2022 until closer to the end of 2023. The lag is primarily due to the cycle of renewals for leases. Since most leases last around a year, a renter’s costs will stay the same all year long. It’s only when the lease ends that a better understanding of the rental market emerges.
The rent-specific portion of CPI has been outpacing overall inflation for decades and most sharply began to diverge in the mid-to-late 2010s.
Who is most likely to rent?
Single people are more likely to rent than couples, regardless of whether they have children, according to a 2022 rental housing report from Harvard University . Hispanic, Black and Asian residents are more likely to rent than own homes when compared with white residents. Those with incomes at or below $74,999 are more likely to rent than own compared with those with incomes $75,000 and over.
Despite soaring rents, it’s still less expensive to rent than to buy. The typical rent for an average three-bedroom place is still more affordable than owning a similar-sized home in 95% of the 222 U.S. counties analyzed by ATTOM, a land and property real estate data curator, in its 2023 Rental Affordability Report.
The generation of adults most likely to rent is Gen Z with 74% of the cohort renting their homes, according to a March 29 data analysis by RentCafe, an apartment listing service. That's a pretty recent development since Millennial home buyers only began to outweigh renters in the cohort as of 2022, the data shows. The analysis found 51.5% of millennials now own their own home. The amount of millennial homeowners increased 28% from 2019 to 2022. But baby boomers are still the dominant generation owning their own homes, representing 40% of all homeowners in the U.S.
Rent vs. income
Generally, households should be spending no more than 30% of their gross income on rent, according to the NYU Furman Center .
That means if a household earns the U.S. median income — $70,784 annually, or $5,899 per month, according to the U.S. Census Bureau — when applying the 30% rule, the goal would be to spend no more than $1,770 per month on rent .
» MORE: Cost of living calculator
Spending 30% of your income on rent means a household is “moderately rent burdened,” but spending 50% or more means a household is “severely rent burdened” by federal standards . Those with the highest rent burden are disproportionately seniors, low-income, immigrants and racial or ethnic minorities, according to a 2015 Zillow analysis of U.S. Census Bureau data. Severely-burdened renters are also more likely to have long commutes via public transit and lack cars. Children are also often present in homes with high rent burdens.
A NerdWallet analysis of rent-to-income ratio by metro area finds that among 227 cities in the U.S. 67% of market rents in March 2023 have rent-to-income ratios that are equal to the recommended 30% or a higher ratio. In other words, typical rents are likely to be burdensome for residents of 67% of U.S. cities measured.
Top 10 least-affordable cities by rent-to-income ratio
Top 10 most-affordable cities by rent-to-income ratio
Find out how affordable your city is. If your city isn’t listed, look for the closest metro area.
National vacancy rates: Homeowner vs. rental
The rental vacancy rate during the first three months of 2023 (6.4%) increased from the fourth quarter of 2022 (5.8%), and is just slightly lower compared with a year ago (5.8%).
Homeownership in the first quarter of 2023 meanwhile, changed little (66%) from the fourth quarter of 2022 (65.9%) or from the first quarter of 2022 (65.4%)
.
» CALCULATE: Rent vs. buy — what’s right for you?
Methodology: Rent-to-income ratios by metro area
NerdWallet pulled the most recent available market rental data for 529 cities from the Zillow Observed Rent Index and matched it with the most recent available median household income data (2021) for cities by the U.S. Census Bureau. Certain cities identified in the Zillow Observed Rent Index weren't included in the U.S. Census Bureau list of median household incomes by city and thus weren't included in this analysis. A total of 227 cities were identified by both sets of data. Then, NerdWallet calculated the rent-to-income ratio using the following formula: Market rent/(median income/12 months).
